Este artículo también está disponible en español.
Understanding Bitcoin’s Latest Buy Signal
In the ever-dynamic world of cryptocurrency, a noteworthy development has emerged. A well-regarded crypto analyst has unveiled a technical chart, the TD Sequential, which is currently indicating a significant buy signal for Bitcoin within the 4-hour time frame. This development suggests a possible shift in Bitcoin’s bearish momentum, offering a crucial opportunity for market participants to consider.
What is the TD Sequential Indicator?
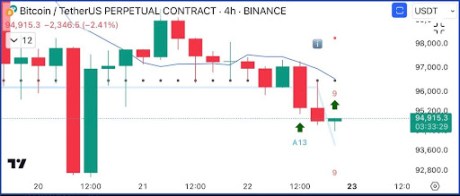
The TD Sequential is a specialized technical indicator that serves as a tool for identifying trend exhaustion and potential price reversals. It generates buy or sell signals, aiding traders in making informed decisions. According to a post on X (formerly known as Twitter) by crypto analyst Ali Martinez, Bitcoin’s 4-hour chart has revealed a green “9” candle. This particular candle is often interpreted as a buy signal, hinting that the bearish momentum might be diminishing, potentially setting the stage for a price rebound.
Analyzing the Significance of the Green 9 Candle
Within a downtrend, the appearance of a green 9 candle is seen as a bullish indicator, suggesting that the prevailing bearish forces may be losing steam. In Martinez’s analysis, the TD Sequential chart also features an “A13” marker, representing a countdown phase that spans 13 additional candles, often signaling a stronger trend exhaustion. This marker reinforces the possibility of a price reversal, offering a potentially lucrative entry point for traders.
Bitcoin’s Current Market Dynamics
Bitcoin’s current buy signal surfaced as its price surpassed the $94,000 mark. This signal points to an optimal time for market entry, with $94,915 identified as a potential entry point for traders aiming to benefit from a possible price recovery. While the TD Sequential is a valuable tool for identifying buy and sell signals, traders are advised to consider other factors such as market volatility and sentiment to make well-rounded decisions.
BTC Market Top Projection: Aiming for $168,500
In a subsequent analysis shared on X, Ali Martinez presented a chart outlining Bitcoin’s potential market top, projected to reach above $168,500. This prediction is grounded in the Mayer Multiple, a metric comparing Bitcoin’s price performance against the 200-day Moving Average (MA).
Decoding the Mayer Multiple
The chart illustrates the Mayer Multiple (MM) with a red line at 2.4 and a green line at 0.8, alongside a blue Oscillator line tracking the MM over time. Historically, Bitcoin price peaks have aligned with the Mayer Multiple reaching 2.4 or higher. Presently, Bitcoin’s Mayer Multiple stands at 1.3845, but should the price continue its upward trajectory, Martinez anticipates a market top exceeding $168,500.
Current Market Status and Future Projections
As of the latest update, Bitcoin’s price is hovering around $94,692. Achieving the projected market top of $168,500 would necessitate a substantial 78% increase from its current market value. Traders and investors are advised to stay vigilant, as the market remains dynamic and subject to rapid changes.
Bitcoin price struggles to hold $95,000 | Source: BTCUSD on Tradingview.com
Featured image created with Dall.E, chart from Tradingview.com


